Why returning customer revenue can hide poor retention
Compare returning revenue with equal-age customer cohorts before deciding whether recent buyers are coming back.

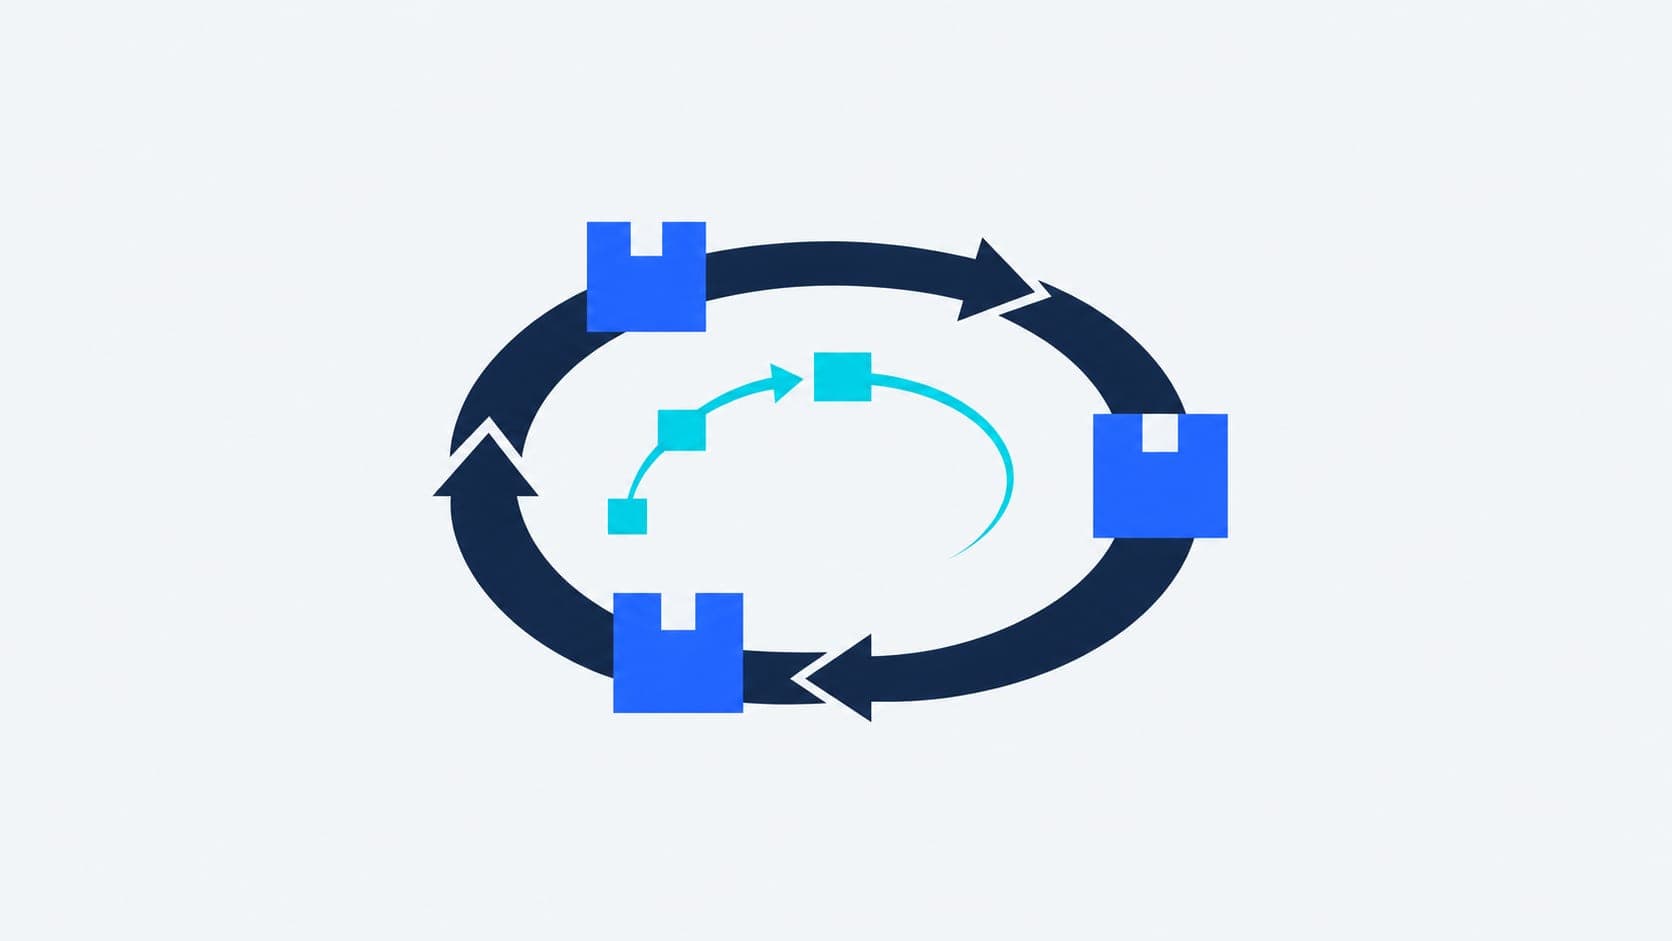
- A higher returning customer revenue share can result from weaker first-order sales, even when repeat revenue stays flat.
- Compare first-purchase cohorts after the same observation window before deciding that retention has improved.
- Count each customer once when calculating a cumulative second-order rate; monthly repeat-purchase percentages cannot simply be added.
- Choose retention work using customer evidence and contribution after costs, rather than attributed campaign revenue alone.
Returning customer revenue can hide poor retention because established buyers may support sales while newer customers fail to return. Its share can also rise when first-order revenue falls. To assess recent customer retention, compare customers acquired in the same period after equal time to place a second order.
A healthy base of established buyers is valuable. The limitation is what that revenue tells you about the customers you are acquiring now. Before increasing acquisition spend or launching another discount, ask whether recent buyers return often enough to support your growth economics.
What does returning customer revenue actually measure?
For this analysis, returning customer revenue means revenue from orders placed after a customer's first order. Returning customer revenue share divides that amount by total revenue in the same reporting period. The measure describes the composition of sales; it does not show how many recently acquired customers placed a second order.
Use a consistent revenue basis on both sides of the calculation. Decide how discounts, refunds, tax and shipping are treated, then record those choices beside the report. Mixing gross repeat sales with net total sales creates a misleading percentage.
The customer count is a separate measure. Shopify's official customer report documentation defines returning customers as purchasers whose order history already includes an order. Its default customer cohorts group buyers by their first-order date.
Neither a large repeat-revenue total nor a high returning-customer share establishes the health of a recent acquisition cohort. Your longest-standing buyers may be carrying the current reporting period.
Measure | Question it answers | Main limitation |
|---|---|---|
Returning customer revenue share | How much of this period's revenue came from repeat orders? | Changes with first-order revenue and repeat-order values. |
Second-order rate within a fixed window | How many buyers in a first-purchase cohort ordered again within the chosen time? | Requires complete observation time and a clear order definition. |
Repeat buyers in a calendar interval | How many cohort members bought again during that interval? | The same buyer can appear in several intervals. |
Contribution per acquired customer within a fixed window | What did the cohort contribute after the costs included in your model? | Depends on complete cost data and a consistent calculation. |
This follows the decision-led approach in our guide to choosing KPIs that change a decision. A sales mix measure and a cohort measure belong together because they answer different commercial questions.
How can the revenue share rise while retention weakens?
Consider a hypothetical refillable skincare retailer. These figures illustrate the calculation and are not a client result. Revenue uses the same net basis throughout.
Monthly sales mix | Earlier period | Later period |
|---|---|---|
Revenue from first orders | €60,000 | €40,000 |
Revenue from repeat orders | €40,000 | €40,000 |
Total revenue | €100,000 | €80,000 |
Returning customer revenue share | 40% | 50% |
The share rises from €40,000 / €100,000 to €40,000 / €80,000. Repeat revenue has stayed flat, and total revenue has fallen. Calling that movement a retention improvement would misread the denominator.
Now examine two fully observed first-purchase cohorts from this hypothetical retailer. Each contains 1,000 buyers. In the earlier cohort, 300 customers place a second order within 90 days; in the later cohort, 200 do.
The second-order rate falls from 300 / 1,000 = 30% to 200 / 1,000 = 20%. Established customers can keep repeat revenue steady while this deterioration develops. The sales mix and cohort comparison can therefore point in different directions without either calculation being wrong.
The opposite situation also deserves care. A successful acquisition campaign can increase first-order revenue and reduce the returning revenue share. That change alone does not establish a retention problem.
ConversionNest's view: Treat returning revenue share as context for a diagnosis. Before changing budgets, inspect the repeat-revenue amount, new-customer volume and comparable cohort outcomes underneath it.
How should you measure whether new customers return?
Calculate a fixed-window second-order rate by dividing cohort customers who placed a qualifying second order within the chosen number of days by all eligible customers in that first-purchase cohort. Count each customer once. Include only customers with enough elapsed time to complete the observation window when comparing completed rates.

For example, a 90-day rate answers whether buyers returned within 90 elapsed days of their own first order. The window starts separately for each customer. Ninety days is an illustrative choice, rather than a universal retention target.
Build a comparable second-order report
- Agree what counts as a purchaseChoose a qualifying order rule, such as a paid, non-test order, and document how cancellations, full refunds and replacements affect it. Keep automatic subscription renewals distinguishable from discretionary repeat orders. Apply the same rule to every cohort.
- Group customers by their first qualifying orderUse a stable customer identifier and the first qualifying purchase date. Check whether your history covers earlier purchases, including relevant offline orders. A data import beginning recently can make established buyers appear newly acquired.
- Choose a window that fits the productInspect the distribution of time to second order among repeat buyers, alongside product usage and replenishment needs. Repeat buyers alone cannot reveal when non-returners would have bought, so use that timing as context. A durable product and a consumable need different expectations.
- Compare customers with equal follow-up timeFor a completed monthly cohort, wait until its latest first purchaser has finished the chosen window. If comparing partially observed cohorts, restrict both to an explicitly defined eligible subset and show the customer counts. Keep incomplete results clearly marked as provisional.
- Show counts and economics beside the percentageReport cohort size, customers reaching a second order, the rate and the cost basis. Review first-order product and acquisition source where sample sizes allow. Small groups can produce large percentage swings from very few purchases.
For a long purchase cycle, a low short-window rate may be expected. Shopify's customer retention guide, updated September 1, 2026, stresses that comparisons depend on product type, purchase frequency and business model. Choose the observation window before judging a cohort.
Read Shopify and Klaviyo cohort reports carefully
Shopify's customer cohort report includes repeat orders made in the first-purchase period in period 0. Its customer report documentation also warns that some customer classifications reflect the entire order history, beyond a selected reporting timeframe. Check the specific report's scope before interpreting a historical count as a fixed-window result.
Klaviyo's official metrics cohort guide explains that cohorts begin with a profile's first recorded event for the selected metric. With Placed Order selected, the first event is excluded from subsequent activity, while the 0 mos column includes later activity in that same calendar month.
Under Klaviyo's Profiles measurement, a customer is counted once per month when they repeat the event. That customer can appear again in another month. Adding monthly percentages therefore double-counts some buyers and cannot produce a cumulative second-order rate.
Calendar months also differ from elapsed-day windows. A buyer who orders near month-end reaches the next calendar interval sooner than someone buying near month-start. Compare like report settings; calculate an exact elapsed-day measure from customer-level order history when that is the decision you need to make.
These are reporting definitions, checked against official documentation on November 5, 2026. They do not establish that your integration contains complete purchase history. Reconcile missing orders and identity gaps before diagnosing customer behaviour. Our guide to GA4 and Shopify revenue differences explains the related order-reconciliation problem.
What should you change when the second-order rate falls?
A lower rate identifies a group worth investigating. It does not establish why customers left or prove that a retention campaign will help. Compare the affected cohort with an appropriate historical group, then gather evidence about the suspected cause.
CXL's cohort analysis article, last updated December 23, 2022, recommends examining first product, first-order campaign and traffic source. That is practitioner guidance for finding useful differences. A channel's lower repeat rate still requires investigation before you cut its budget.
Pattern to investigate | Evidence to check | Possible next action |
|---|---|---|
Decline concentrated in one first product | Availability, complaints, refunds and product use | Fix a verified product or fulfilment problem before increasing reminders. |
Decline concentrated in a promotion | Offer terms, customer mix and purchase quantities | Test a revised acquisition offer against contribution and repeat behaviour. |
Similar buyers return later | Time-to-second-order distribution and initial basket size | Reassess reminder timing and the observation window. |
Repeat purchases depend on discounts | Net order value, product cost and offer exposure | Test whether the offer adds contribution after its costs. |
These patterns are ConversionNest analysis and proposed investigation paths, rather than findings about your store. Customer interviews, support records and order evidence help distinguish weak product fit from poor timing or a broken delivery promise.
If you test a reminder or incentive, define the eligible audience and outcome in advance. Where feasible, randomly retain a comparable holdout group. Evaluate second orders and contribution across all assigned eligible customers over the same window, including customers who never open the message.
Attributed email revenue can help describe campaign activity. Establishing additional purchases requires a comparison that addresses what customers would have done anyway. Keep acquisition spending, discounts, product costs and variable fulfilment costs explicit when assessing cohort economics.
Start with one fully observed cohort comparison and one evidenced problem. Assign an owner and a review date. Increase retention spending when the expected commercial benefit justifies the cost, and keep first-order revenue visible beside the returning share.
Frequently asked questions
Is returning customer revenue the same as customer retention?
Returning customer revenue measures sales from repeat orders. Customer retention concerns whether customers continue buying over time, so use comparable first-purchase cohorts to assess recent buyer behaviour.
Why is returning customer revenue share increasing while sales fall?
The share can rise when first-order revenue falls faster than repeat revenue. Check both revenue amounts before treating a higher percentage as improved retention.
How do you calculate a 90-day second-purchase rate?
Divide customers in a first-purchase cohort who place a qualifying second order within 90 days by all eligible customers in that cohort. Count each customer once and allow every included customer the full observation window.
Can you add Klaviyo's monthly repeat-purchase percentages?
No. The same profile can make repeat purchases in several calendar months, so adding the monthly percentages can count that customer repeatedly.

Sima Damar Beygu
Founder of ConversionNest. 10+ years in growth marketing, managing 300K euro monthly media budgets and scaling acquisition across 15+ markets. MSc in Digital Marketing from University College Dublin. Google and Meta certified.
Sima on LinkedIn
Why Google Ads counts duplicate conversions and how to fix it
A repeated tag and two bidding actions for one purchase are different failures. Trace the order, identify the duplicate layer and verify the repair.

Why GA4 revenue does not match Shopify, and when to worry
A revenue gap can come from definitions or missing transactions. Reconcile individual orders before blaming attribution or changing the tracking setup.

ChatGPT traffic dropped in GA4? Audit the October tracking gap
ChatGPT referral traffic appeared to fall sharply in October 2026. Learn how to investigate missing UTM attribution, compare Direct traffic and protect your AI search reporting.